
Business Intelligence & Visualization
DataDax
A configurable analytics workspace with data connectors, table and pivot widgets, charts, dashboards, map views, access roles and sharing.
We design and engineer the systems that turn fragmented business data into trustworthy insight and informed action.
From source integration and modern data platforms to dashboards, forecasting and knowledge graphs, OdyxAI connects the data foundation to the decisions it needs to support.
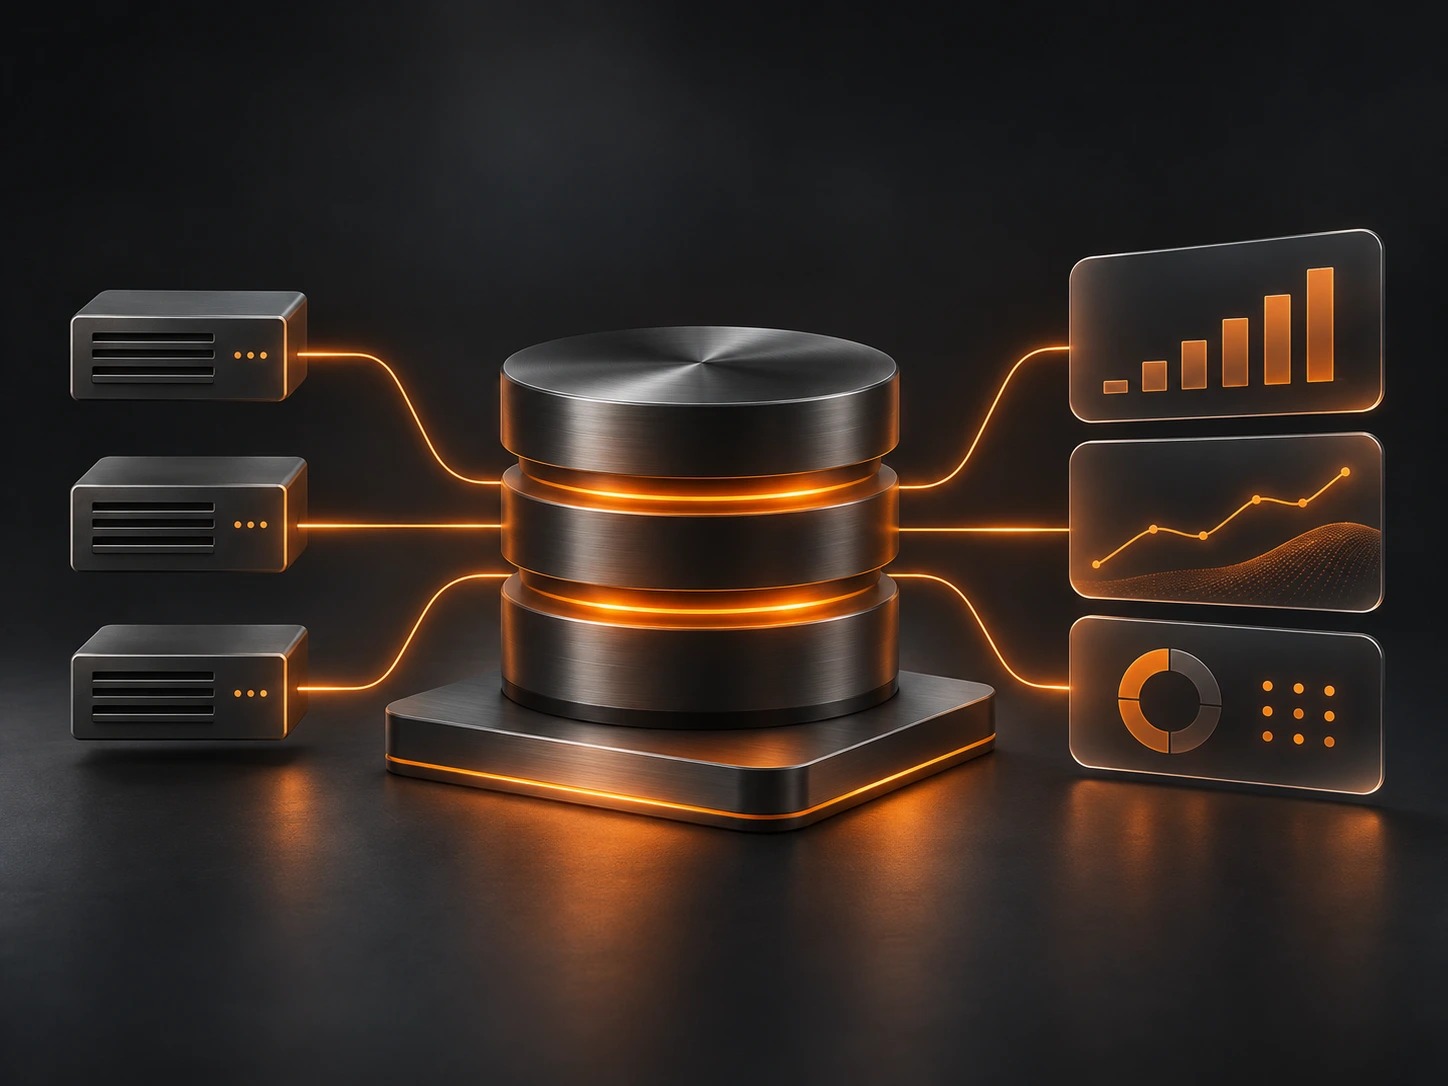
The work is not finished when data reaches a dashboard. We connect collection, definition, analysis and delivery so information can be used consistently across the business.
Six connected disciplines that turn raw information into reliable data products, analytical experiences and intelligence workflows.
Explore Data & Decision Intelligence →Design ingestion, ETL/ELT, orchestration and APIs that move data reliably from operational systems into usable analytical structures.
Build fit-for-purpose data storage, modeling and processing layers for structured, semi-structured and high-volume information.
Deliver dashboards, reports and self-service analytics backed by understandable, consistent definitions of key metrics.
Apply statistical and machine-learning approaches to demand, performance and time-series questions, with validation and clear uncertainty.
Connect entities, relationships and enterprise knowledge for search, contextual retrieval and more intelligent analytical experiences.
Plan access rules, validation, lineage, cataloging and monitoring so stakeholders understand where information came from and whether it is fit to use.
Whether you need a stronger foundation, clearer performance visibility or forward-looking insight, we design around the business question first.

Unify ERP, CRM, operational databases, spreadsheets and third-party services into a data flow that people can maintain and trust.
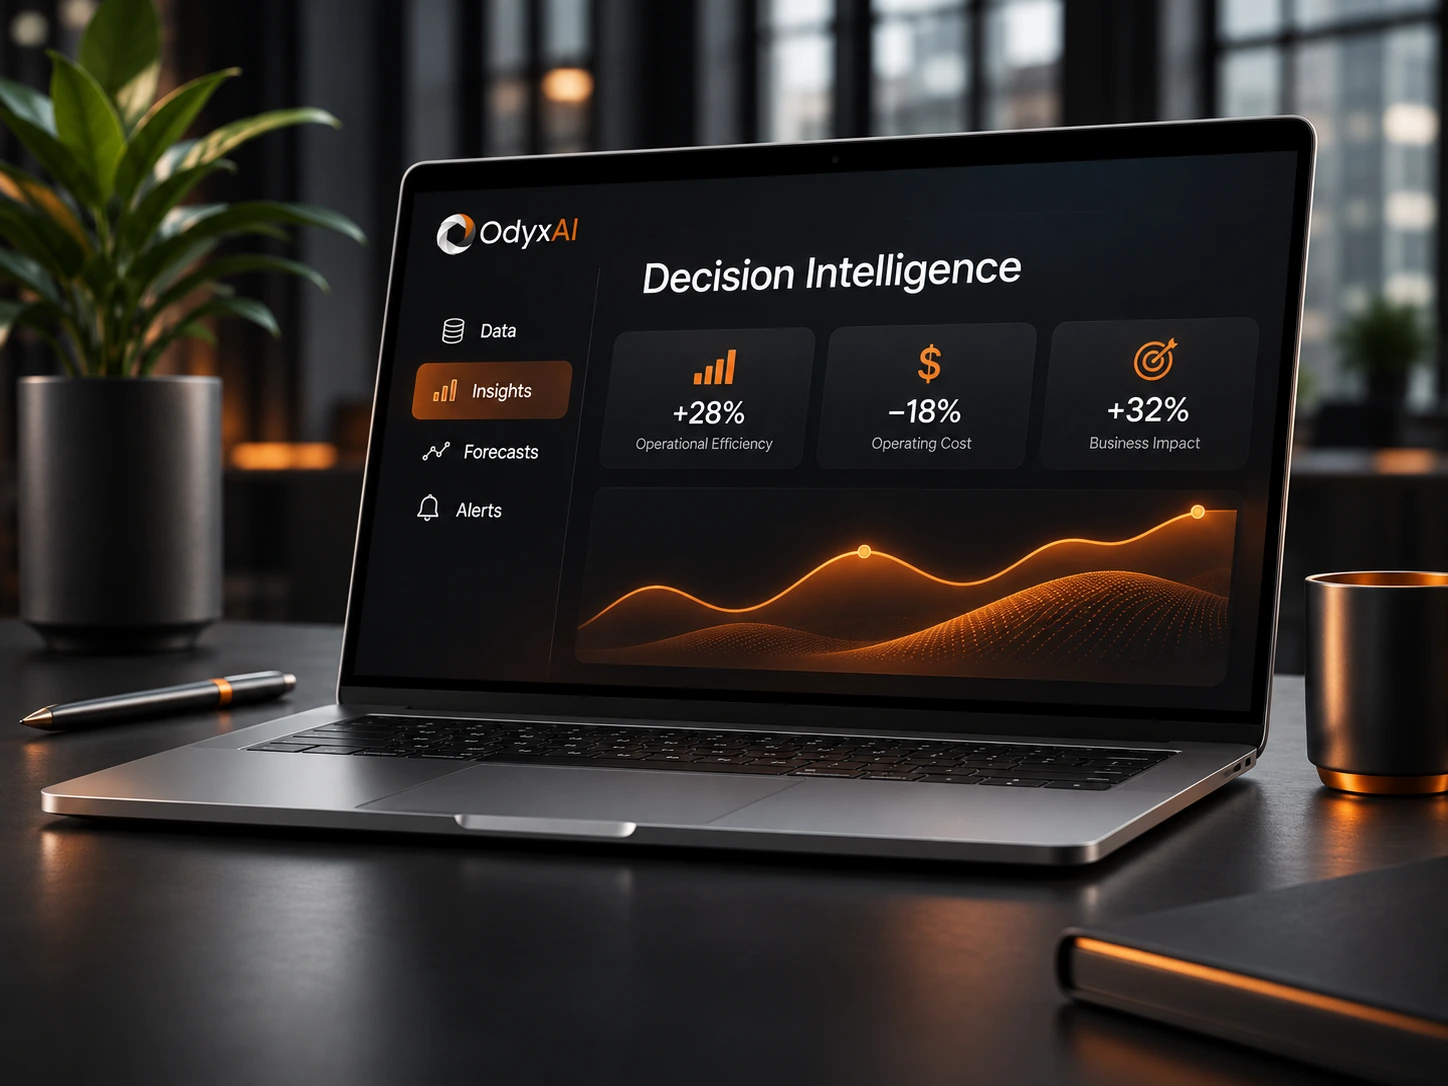
Replace disconnected reports with dashboards and decision-ready metrics across operations, finance, sales and leadership.

Bring historical patterns, forecasting and analytical scenarios into planning decisions without hiding model limitations.
The exact scope depends on your environment, but these are the practical deliverables that bring architecture, analysis and operation together.
A five-stage delivery rhythm keeps business stakeholders and engineering teams aligned on priorities, decisions and releases.
Understand business questions, stakeholders, data sources, constraints and current workflows.
Define target architecture, priority use cases, metrics, delivery scope and security boundaries.
Engineer pipelines, data models, analytics and intelligence components in testable increments.
Validate data and outputs, release into the agreed environment and prepare users and operators.
Monitor data quality and adoption, optimize performance and extend successful use cases.
We work with modern analytics, data and cloud technologies.
Stack selection depends on the existing environment, governance requirements, performance needs and internal team capabilities.
Selected OdyxAI platforms show how data visualization, forecasting and knowledge relationships can become practical user experiences.
Explore Our Work →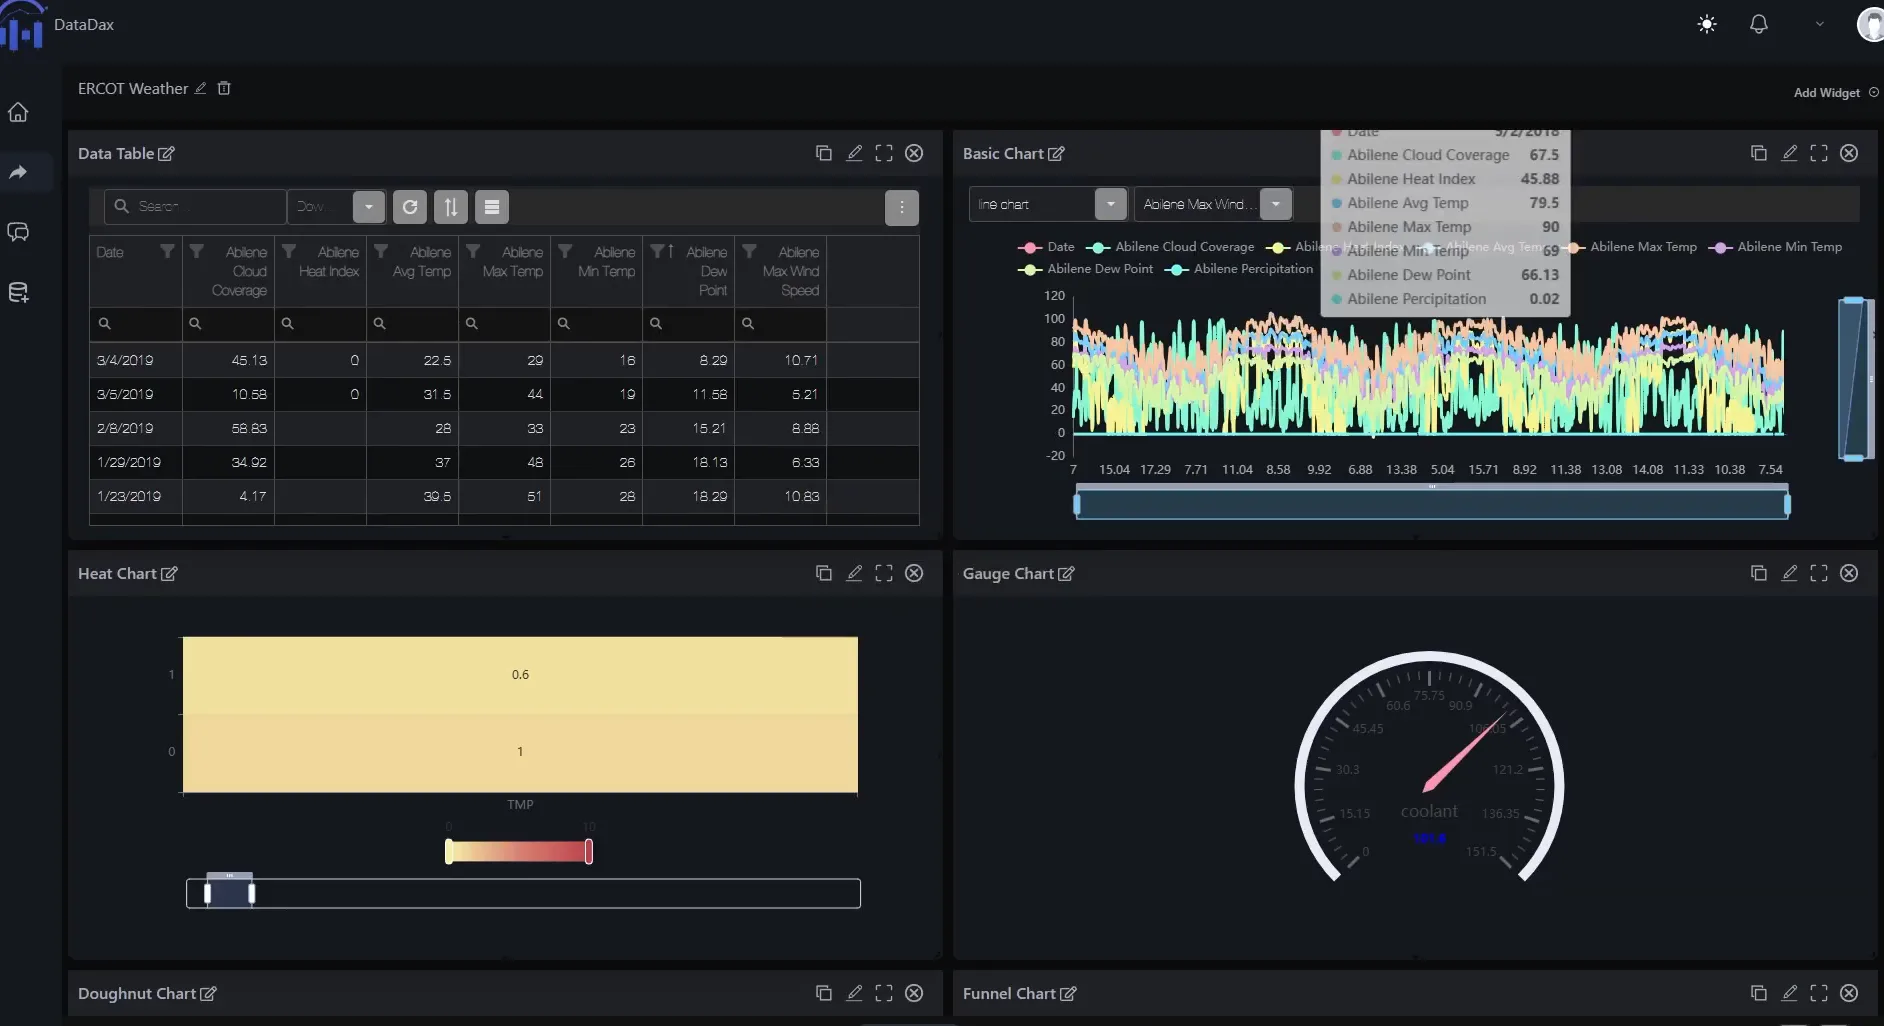
A configurable analytics workspace with data connectors, table and pivot widgets, charts, dashboards, map views, access roles and sharing.
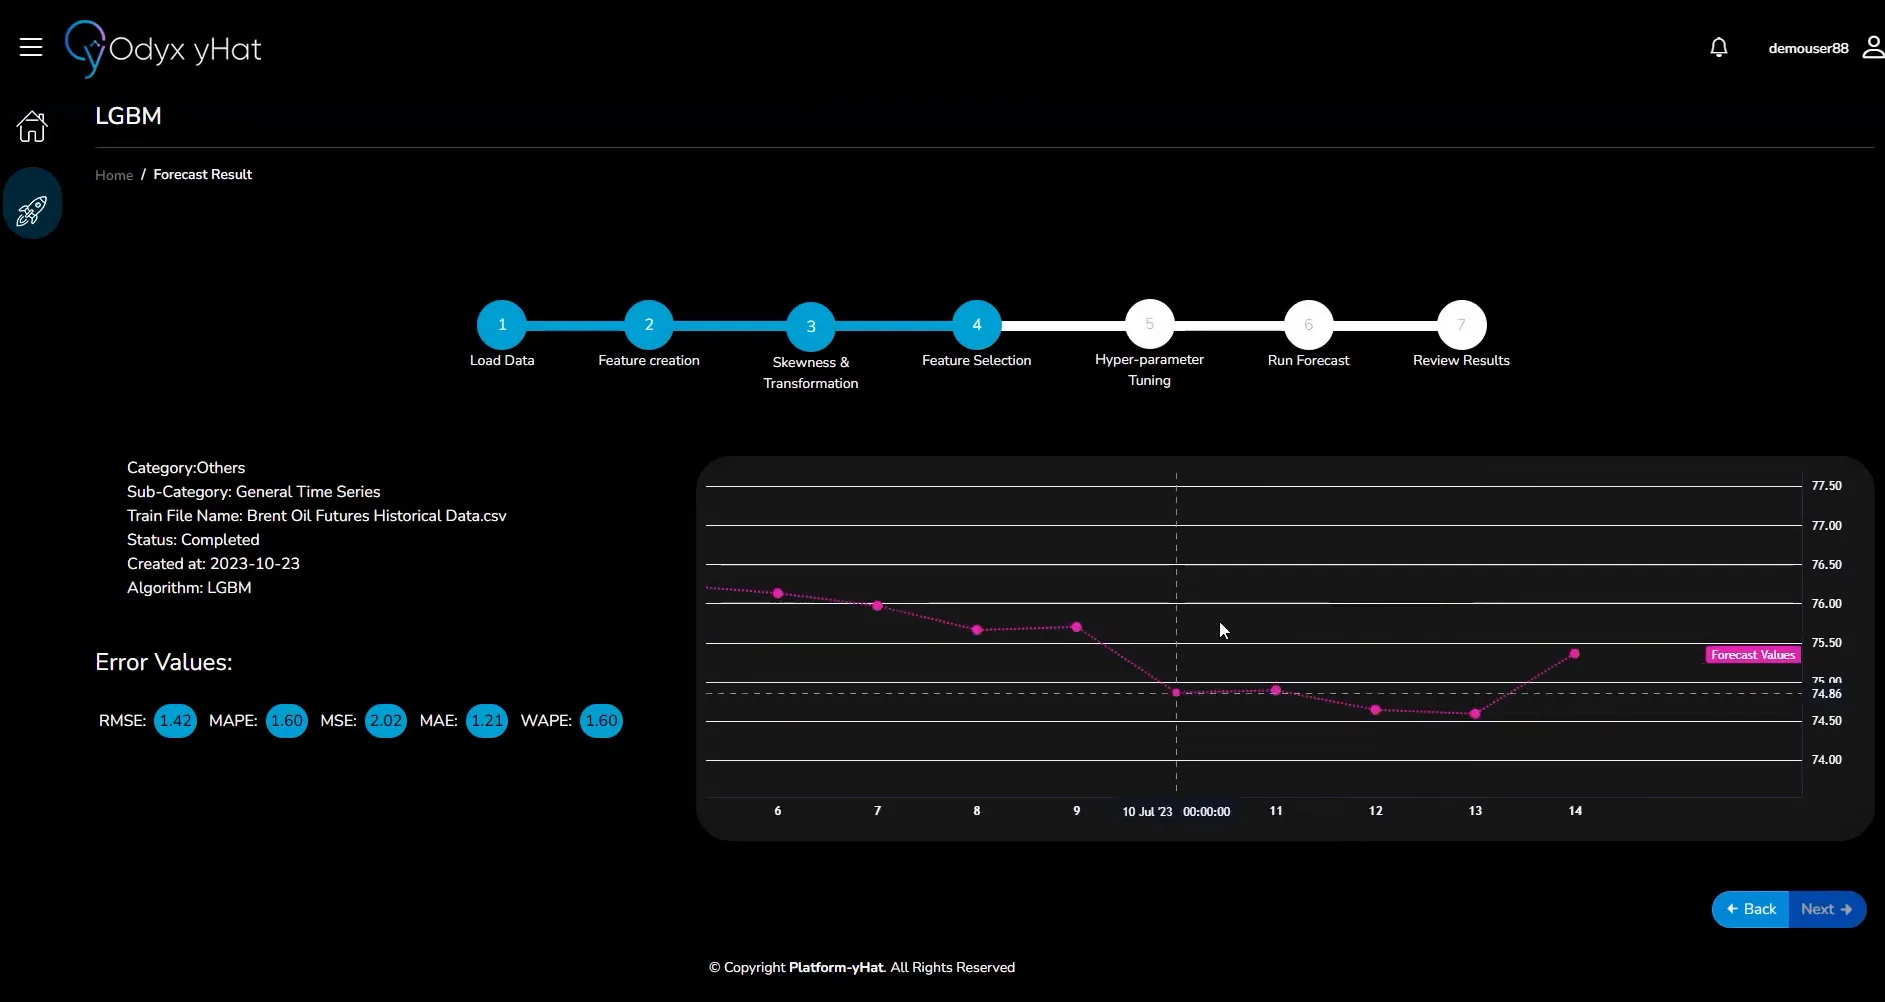
A forecasting workflow with data preparation, model selection, adjustable horizons, tuning controls and visual model-evaluation outputs.
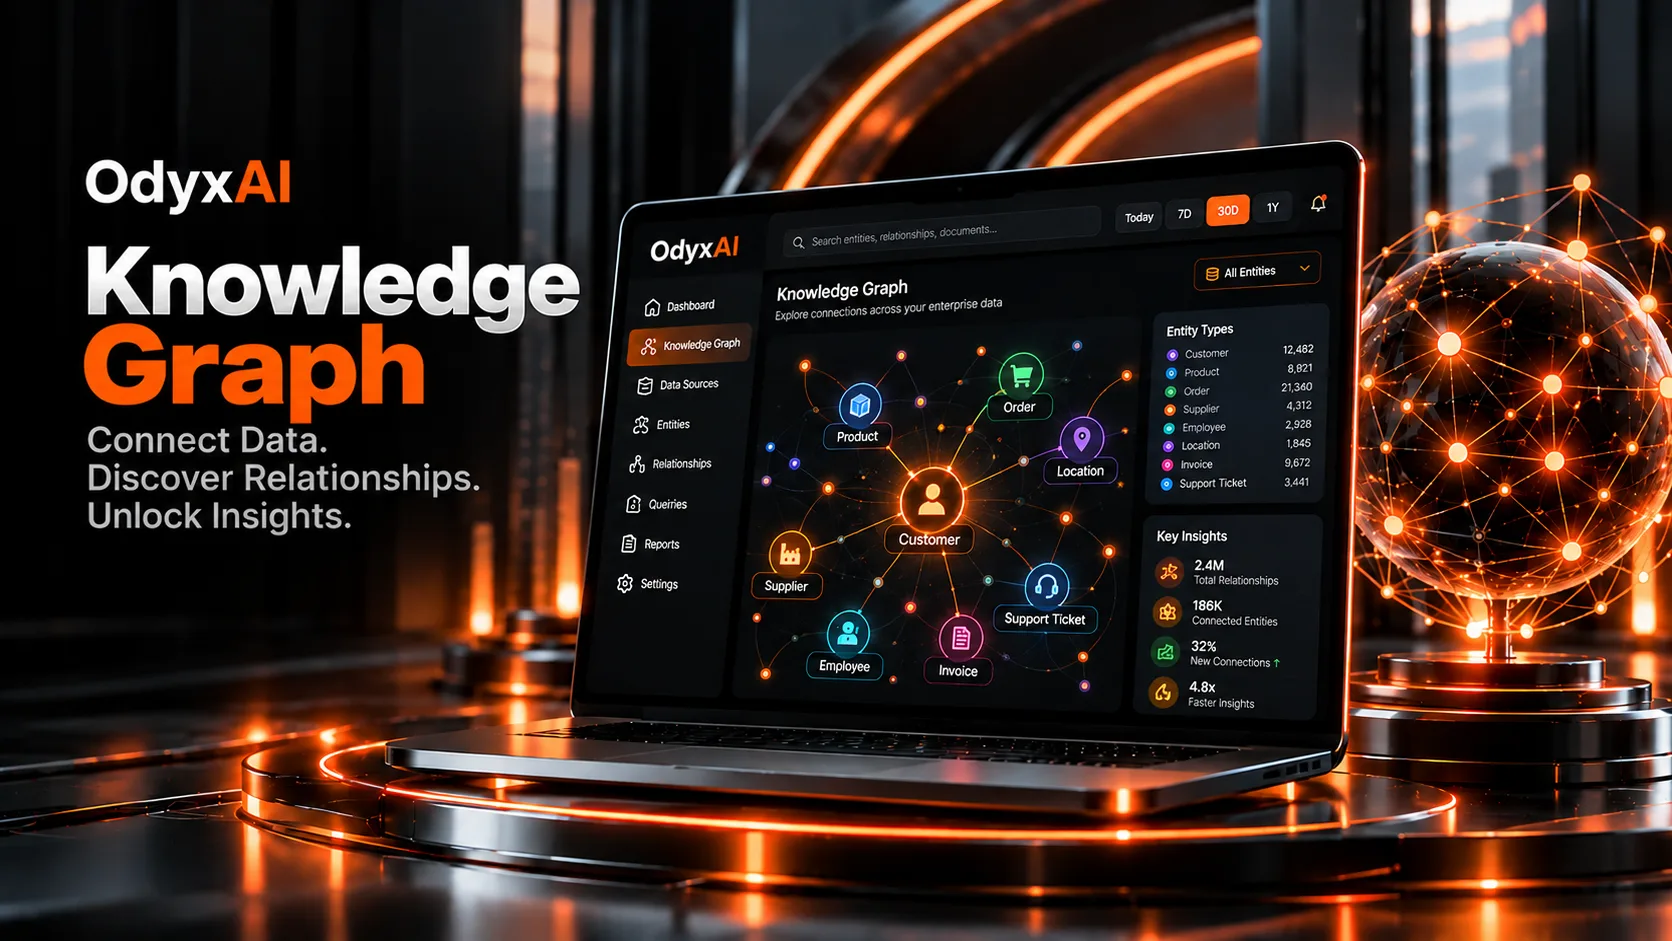
An enterprise knowledge-graph concept for representing relationships between information and making context more accessible to downstream analytics and retrieval.
Start with a defined platform initiative, extend your engineering team or keep the system improving after launch.
A defined data-platform or analytics initiative with agreed scope, milestones and delivery ownership.
Data, AI, analytics and platform specialists who collaborate as an extension of your existing team.
Ongoing pipeline monitoring, platform maintenance, improvements and support under an agreed operating model.
Yes. We begin by mapping your data sources, interfaces and access constraints, then design appropriate APIs, connectors and ETL/ELT pipelines. The implementation depends on the systems and permissions available.
Not necessarily. We assess what already works and can modernize incrementally: improving pipelines, metric definitions, models or dashboards while retaining useful infrastructure.
We define business metrics clearly, validate transformations and apply suitable model evaluation methods. Forecasting work can include baselines, time-aware backtests and error analysis so stakeholders see assumptions and limitations.
Access controls, data classification, encryption options, retention, monitoring and governance requirements are defined for the environment and engagement. We do not assume a single security pattern fits every client.
If your information is scattered, your reporting is difficult to trust or your team needs better analytical decisions, bring us the challenge. We will help define the foundation, first use case and engineering path forward.

